|
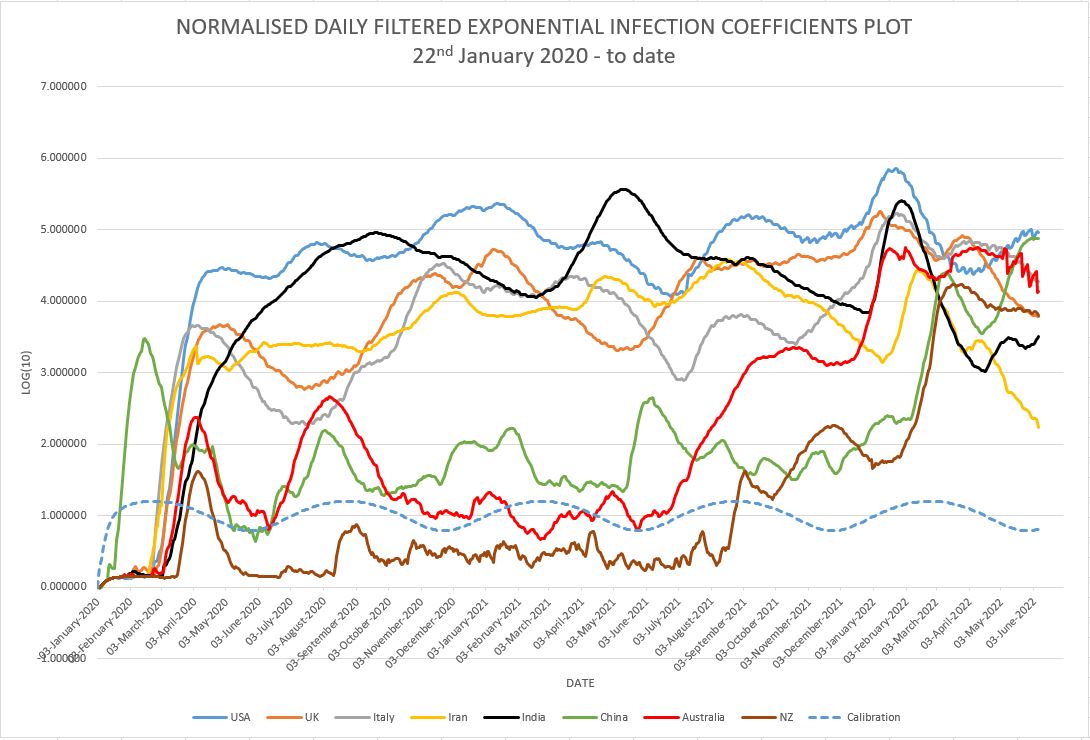
Using an engineering signal processing approach, the Chart data presented below is an exercise to provide a daily view of the veracity of the spread of COVID-19 in the eight early infection countries selected for review. This offers readers both historical and current information on status and infection risk within these countries - two important
parameters that are not conveyed in media reports making it difficult, if not impossible, to fully appreciate what is happening both nationally and globally over longer periods of time. An infection spread model has been developed using the daily COVID metrics published on-line by the World Health Organisation (WHO) since 22nd January, 2020.
Daily new infection numbers are entered into the model that can calculate predictive infection numbers for the next day with an accuracy of better than 1%, though recently Omicron has challenged this result recently in a few countries while the filters adapt to the new variant. In addition the normalised, filtered logarithmic coefficients of the infection data are calculated and plotted
to provide the Charts displayed below. This data is provided with awareness of the pitfalls of trying to compare outcomes in different countries using different reporting metrics, having different national demographics, social and religious practices, different socio-economic and health care infrastructure, different age demographics, different infection control strategies and level of contact tracing, as well as
different national testing strategies and response. Nonetheless, they provide interesting viewing and continue to correlate closely with the media reports coming out of the countries analysed.
The PDF file1 iimage below may be viewed as a full sized Chart along with a detailed analysis of the COVID-19 status in the eight countries monitored, while the second PDF file 2 image is the Chart for Europe that now replaces India which has been shifted into PDF file 1.
|